ProjectLiveInternal: IR Hub / Analytics Hub

Project profile

Outside In

A banking-market intelligence system that turns public disclosures and market data into executive dashboard views.

Outside In is built around a simple belief: strategic banking questions should not require manually reopening PDFs, market pages, and regulator spreadsheets every time.

Live

Status

Registry state

AI-assisted decision intelligence and structured market data

Profile

Macro tailwind

2026-04-29

Updated

Public build log

What it is

A backend ingestion system and static dashboard layer for outside-in analysis of Australian banks: market performance, share, financial metrics, filings, macro context, and data freshness.

AI-assisted decision intelligence and structured market data

Organizations are trying to make AI useful inside decision workflows, not just chat windows. Market intelligence is a natural fit because the raw material is fragmented, public, and time-sensitive.

Core functionality

Scheduled ingestion

Pulls market, macro, regulatory, bank-document, and banking performance data on scheduled jobs.

Disclosure extraction

Uses AI-assisted extraction to convert bank PDFs and filings into structured metrics, sections, and narrative signals.

Dashboard snapshots

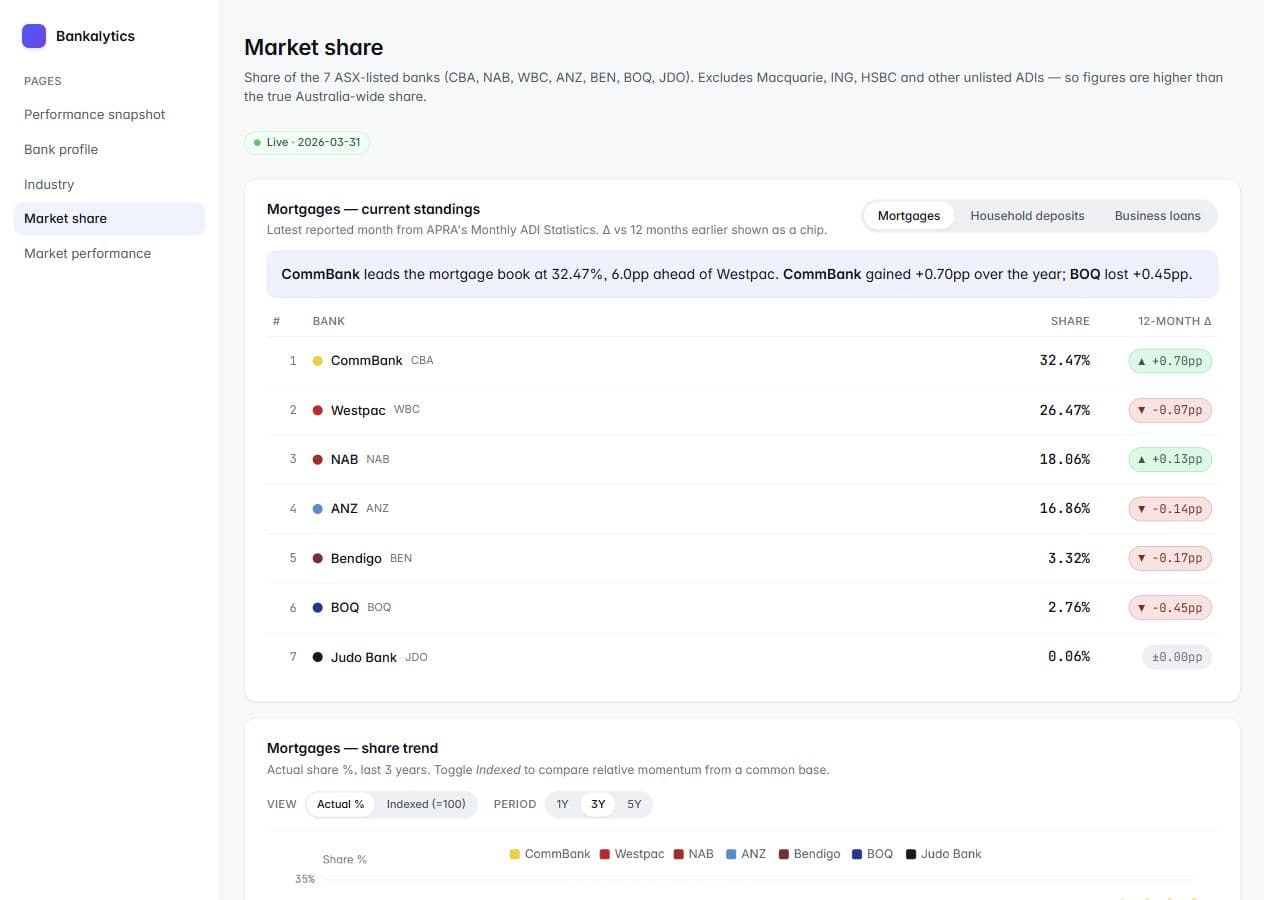
Publishes static read-only dashboard pages for bank profiles, market share, performance snapshots, and industry trends.

Health and freshness

Tracks ingestion runs and page-level freshness so readers can see whether the data is current.

Architecture

Outside In separates ingestion from presentation. GitHub Actions and Node scripts collect and transform data; Supabase stores read-optimized tables and views; static HTML pages consume public-read data for dashboard output.

Stack

  • Node ingestion scripts
  • GitHub Actions cron workflows
  • Supabase Postgres with public-read patterns
  • AI-assisted PDF extraction
  • Static HTML dashboards with shared assets

Data flow

  • Scheduled jobs fetch upstream market, macro, regulatory, and bank-document sources.
  • Transformers normalize data into canonical tables and views.
  • Extraction jobs turn filings into structured metrics and sections.
  • Static dashboards read curated snapshots and render executive views.

Safeguards

  • Portfolio copy uses public-safe system descriptions only.
  • No service-role details, project identifiers, exact secrets, or operational schedules are exposed.
  • Dashboard links point to live public HTML pages, not private source repositories.

Customer and business lens

Wedge

Replace repeated analyst data gathering with a living outside-in dashboard for a focused sector.

Model

Potential paths include internal strategy tooling, subscription intelligence dashboards, bespoke sector monitors, or analyst workflow products.

Use cases

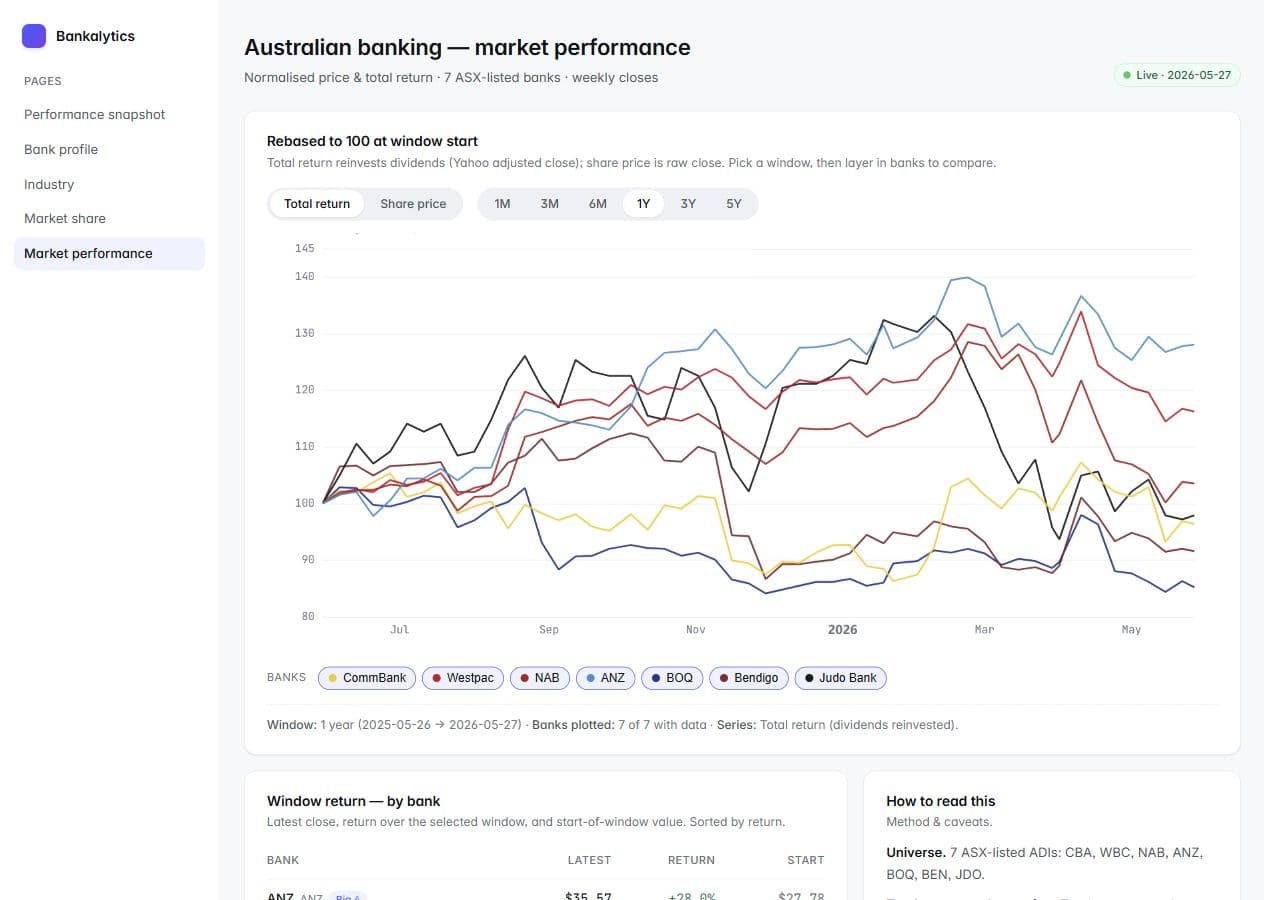
  • Compare bank performance across market and reported metrics.
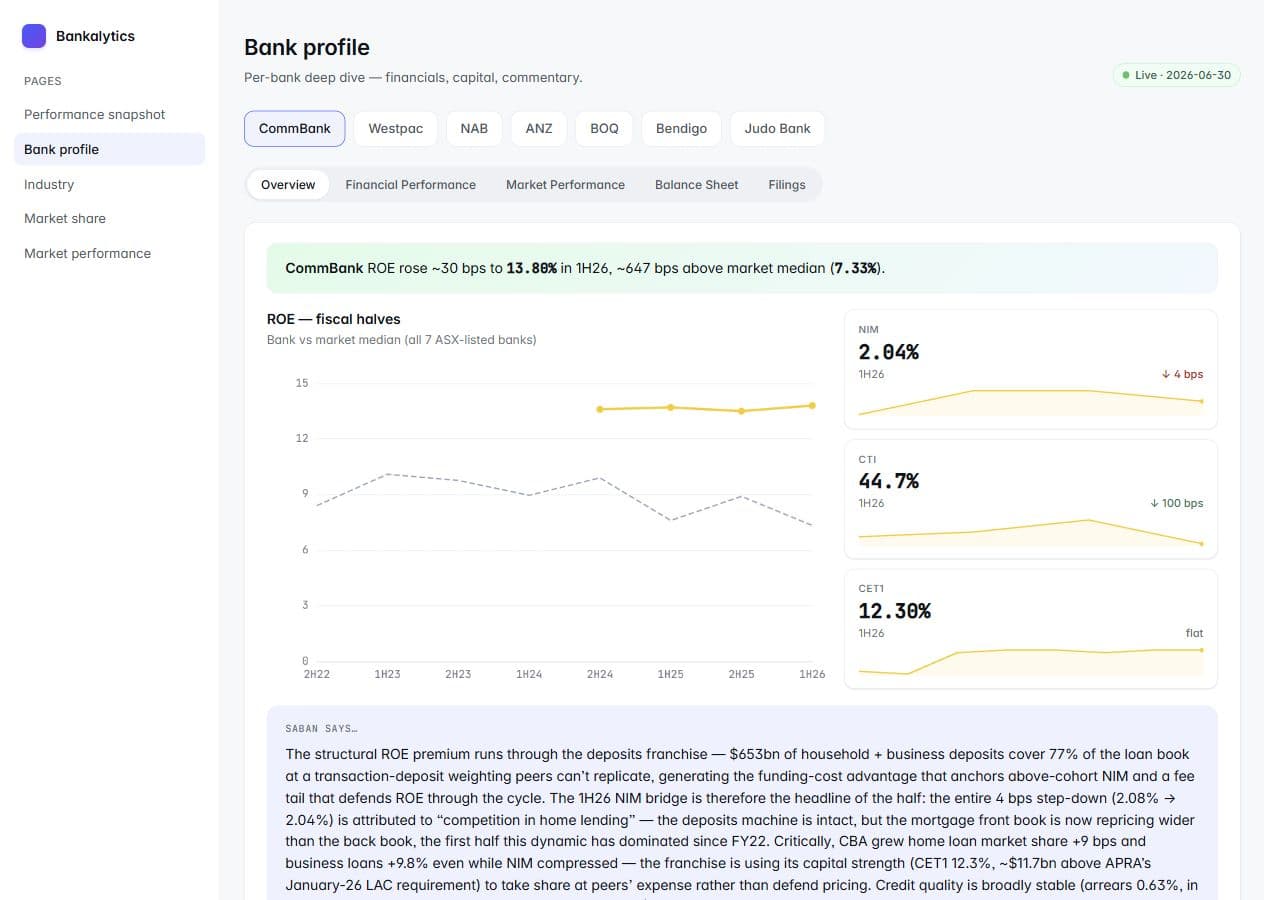
  • Review a single bank profile with filings and performance context.
  • Track market share and sector trends over time.
  • Monitor ingestion health and data freshness.

Risks to watch

  • Source drift can silently break ingestion without strong tests and health checks.
  • AI extraction needs provenance, review, and conservative claims.
  • Dashboard readers need freshness and source context to trust the numbers.

Personas

Strategy executive

Needs a fast view of how competitors and the sector are moving without waiting for a custom pack.

Investor-relations analyst

Wants filings, metrics, and market movements organized around the questions stakeholders ask.

Banking analyst

Needs repeatable benchmarks, freshness indicators, and source-aware metrics.

The exec skimmer

Wants the headline, delta, and confidence level in seconds.

The analyst operator

Needs traceable metrics and wants to know where each number came from.

The build-in-public reader

Wants to understand how public data becomes a useful dashboard product.
Progress kanban

Shipped

  • Bank-profile and market-share dashboard pages
  • Market-performance and industry-trend pages
  • Scheduled ingestion scripts and health checks
  • AI-assisted document extraction paths
  • Static dashboard styling and freshness chips

In flight

  • Financial performance tab polish
  • Live data wiring and freshness consistency
  • Curated P&L and metric coverage improvements

Backlog

  • More sectors or peer groups
  • Richer narrative summaries
  • Automated insight alerts
  • Public-safe methodology notes

Visual evidence

Outside In bank profile dashboard screenshot
Live static bank-profile page from the public dashboard output.
Outside In market share dashboard screenshot
Market share page with league table and trend context.
Outside In market performance dashboard screenshot
Cross-bank market performance view.

Links and build receipts

Build receipts

  • Recent source signals include live data wiring for bank profiles, market share, market performance, performance snapshots, and filings.
  • The public GitHub Pages root 404s by design/current configuration; individual dashboard pages are the stable links.